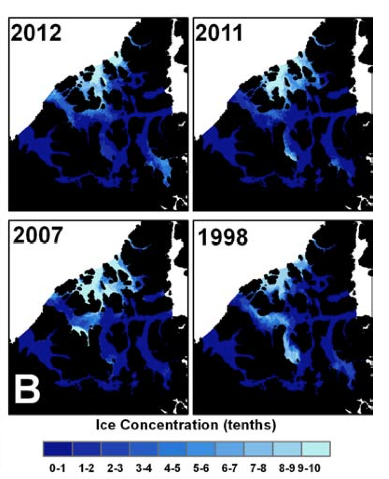
Prior to the sea ice melts of 2012 and 2011, 1998 and 2007 were described as extreme low ice years (Figure 1). They were seasons with the least ice cover ever recorded. This phenomenon was the result of ever increasing Arctic temperatures with consequential decreases in ice thickness and extent. However, the exact mechanisms of sea ice decline in the Canadian Arctic Archipelago differed in these two corresponding years. First year ice did not persist through the summer melt for either year; the distinction was in the melt season’s length and intensity. The ice melt began very early and promptly in 1998, leading to an early divergence from the long running average. In 2007, the ice did not deviate from the average until an intense melt commenced in July. The 1998 melt season initiated with almost 50% more ice present than in 2007, however, the low ice conditions were similar by the end of the season. This means that a larger volume of ice was melted in 1998 because more radiation energy was available, heightening the positive feedback between warm temperatures and ice melt. The overall melt term was longer in duration in 1998, but more intense and rapid in 2007 (Howell et al., 2010). The extreme low sea ice levels of 2011 was in part due to anomalously high summer temperatures and solar radiation in addition to a restricted inflow of multiyear ice. The slightly less extreme sea ice melt of 2012 was due to a higher magnitude of multiyear ice inflow, which was impeded by arctic atmospheric circulation the prior year (Howell et al., 2013).

of 2012, 2011, 2007 and 1998 (Howell et al., 2013). Click
figure for larger image.
1998, 2007 & 2012: Low Ice Years
At the time the melt season of 2012 had the lowest observed sea ice extent. This record has since been surpassed, but 2012 stands out as year for particularly low ice extent over summer months. Between 2003-2012, 2012 had the highest March sea ice extent at just 4% below the average (1979-2000). Thereafter, the sea ice melt progressed very rapidly, resulting in an extensive loss in late summer (Perovich et al., 2012). The August 2012 melt was influenced by a highly negative North Atlantic Oscillation, which resulted in a remarkably powerful storm system. The storm system amplified ocean turbulence and damaged sea ice, leading to intensified melt. Overall, the sea ice loss of 2012 was almost 20% lower than the previous extreme low ice years and 49% lower than the instrumental average (Perovich et al., 2012).
September Arctic Sea Ice Extent Video from NSIDC on YouTube.
2015 & 2016: Lowest Ice Years on Record
The maximum sea ice extent of 2015 saw the lowest maximum observed sea ice extent since instrumentation measurement initiated in 1979, occurring on February 25 (NSIDC, 2016). The 2016 maximum was only just higher than that of 2015. These two years are the lowest maxima in the satellite record. The year of 2016 saw a maximum monthly average of 14.43 million square kilometers, which is 1.09 million lower than the 1981-2010 average. It was only 40000 square kilometers greater than the 2015 maximum. The leading cause for 2016’s low maximum was abnormally high air temperatures over the Arctic Ocean. During March the air temperatures were around 3 degrees Celsius warmer than average for the Arctic Ocean near land, and around 6 degrees above average near the north pole. Other factors played a role in the low extent as well, such as warm Atlantic waters making their way northward. Overall, the 2015 and 2016 years represent the lowest maximum sea ice extent thus far, continuing a trend of falling yearly sea ice maxima (NSIDC, 2016).
For the current sea ice extent see the Sea Ice Current page.
References
Sea Ice Links
Material on this page was provided by Maren Pauly and Tristan Mills, Department of Geography, University of Waterloo
